Gantt Charts: The Basics
There are many different organizational tools available for managers and leaders to help plan and track their projects. Gantt charts are a widespread choice when it comes to setting out your project clearly and simply.
They have numerous benefits regardless of the size of your team or project. Here are just a couple of basic pieces of information about Gantt charts, what they do, and whether you could benefit from using them.
What are they?
A Gantt Chart is a bar chart used in various businesses and industries to help show a project’s progress and schedule over a specific time. There are many different software types with various functions and extras, so you will tailor your chart to your requirements and make it work for you.
Organizational software should not make your job even harder; it should allow your project to move along smoothly and efficiently. A Gantt chart’s contents and components can look different, but all Gantt charts start with an X and Y-axis.
Components of a Gantt Chart
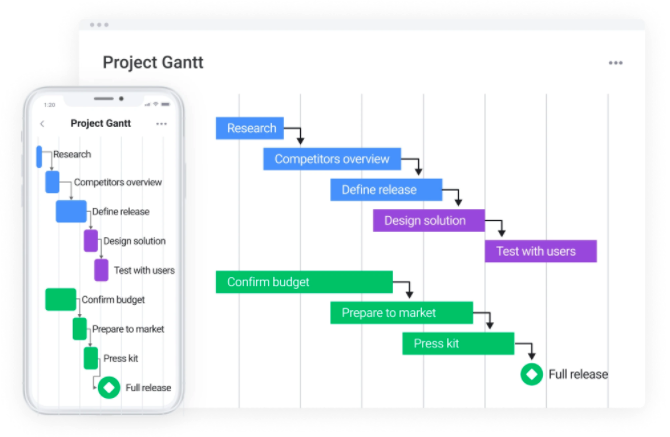
Time: the date and duration of a task can be shown in different measurements, such as hours, days, minutes, or weeks. The current day and time are highlighted, and the bar’s length indicates the expected task duration;
Tasks: the activities that need to be completed. You can also add groups and subgroups to make the chart as detailed as possible;
Status: how far through to being completed each task is. Examples of statuses include ‘up next,’ ‘stuck,’ or ‘planned’;
Owner: the person or persons responsible for the task;
Milestones: mark the end of a certain part of the project and are overarching tasks that don’t have a duration;
Dependencies: Most modern Gantt charts contain dependencies. These are how one task connects to another, and it is often required for a dependency to be completed before you can progress to the next one. In some Gantt charts, there may be the option to prevent tasks from starting until another task is completed.
Gantt charts: when can they be used?

Gantt charts are used in many different industries and businesses, as they are flexible and customizable. They can be used to plan out your workflow, determine the critical path of a project, and interpret and set deadlines. They are great visual ways to display your project and schedule, allowing your whole team to see what still needs to be done and how far they have come.
Does your business need them?
Gantt charts and their variations are handy management tools that your business could benefit from. The software can make it easy to visualize your project’s progress, assign tasks and manage the overall project. Using a flexible Gantt chart system can also make it easier to adapt when plans change and adjust components such as dependencies and tasks when necessary.