How to Use Heat Maps for Better Content Marketing in 2026
✨ Key Points
- Heat maps show real user behavior so you can improve content optimization and conversion rate optimization (CRO).
- Small layout changes can increase dwell time, reduce bounce rate, and boost conversions.
- In 2026, behavior-driven content strategies directly support SEO, engagement, and long-term website authority.
If you’re getting traffic but not conversions, the problem may not be your content it may be how people interact with it.
In 2026, content marketing is driven by user behavior analytics, not guesswork.
If you’ve searched for how to increase website conversions, reduce bounce rate, improve landing page performance, or boost content marketing ROI, heat maps are one of the most practical tools you can use right now.
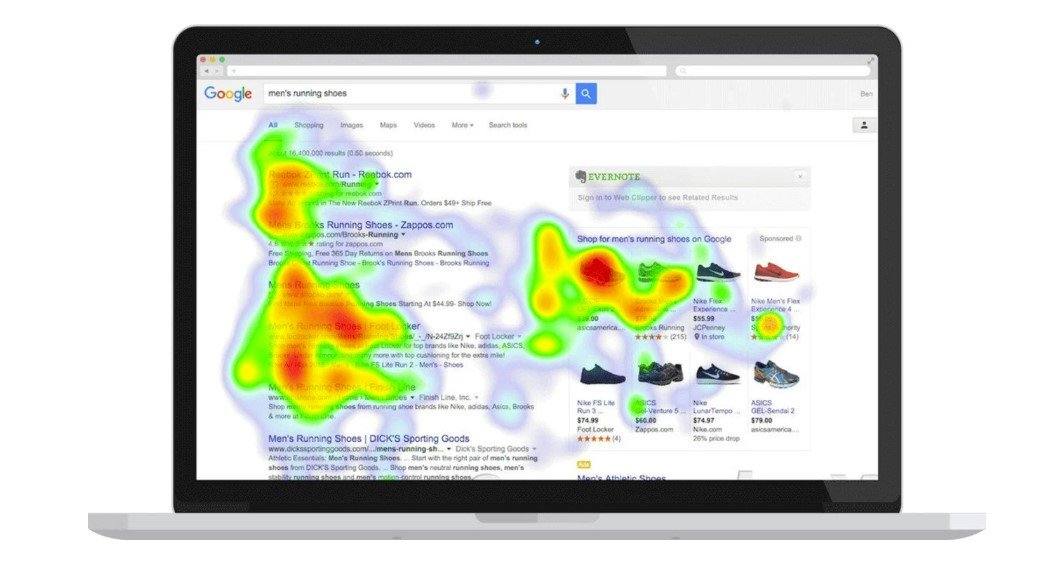
Heat maps show you exactly how visitors behave on your website. Instead of relying only on page views or traffic numbers, you can see:
- Where users click the most;
- How far they scroll;
- Where they stop reading;
- Which sections they ignore;
- Where your call-to-action (CTA) loses attention.
Studies show users spend nearly 80% of their time above the fold, and layout changes based on heat map data can increase conversions by 15–35%.
That’s a significant improvement simply from better placement and structure.
Modern tools like Hotjar, Microsoft Clarity, and Crazy Egg help you track:
- Click maps (what gets attention)
- Scroll maps (how deep people go)
- Session recordings (where friction happens)
In today’s attention economy, search engines measure behavioral signals like dwell time and engagement depth.
That means optimizing layout using heat map insights not only improves conversions it can also strengthen your SEO performance and support your conversion-focused content funnels.
Instead of asking, “Why aren’t people converting?”
You start asking, “Where are they dropping off — and how can I fix it?”
What is Heat Map Analysis and How to Optimize for a Better User Experience
Heat map analysis tool is a tool that helps companies to understand how their website is used by their customers.
It helps them to understand the customer journey and identify the pain points in the experience.
Heat map analysis can be used in many different ways.
One of this tool’s most popular use cases is analyzing website usability.
This article will show you how to optimize your website for a better user experience using heat map analysis.
How Heat Maps can Help with 5 Awesome Examples of Customer Journey Analysis
Heat maps are one of the most practical tools for understanding real customer behavior on your website or app.
Instead of guessing what works, they show you exactly where users click, how far they scroll, what grabs their attention, and where they lose interest.
This makes them extremely valuable for improving user experience (UX), increasing conversion rates, and strengthening your overall content marketing strategy.
When you can clearly see where visitors drop off or hesitate, you can quickly identify friction points and optimize layout, messaging, and calls to action.
Creating heat maps today is simple. Tools like Heatmapper, Crazy Egg, Microsoft Clarity, and Hotjar provide click maps, scroll maps, and session recordings that reveal how users interact with your pages.
Even platforms like Google Analytics and Adobe Analytics can support behavior analysis when paired with visualization tools.
In the examples below, you’ll see how heat maps are used across different industries to improve engagement, reduce bounce rates, and create smoother, higher-converting customer experiences.
- Example 1: A coffee shop uses heatmaps to see where customers spend most of their time on their website and then make changes accordingly;
- Example 2: A university uses heatmaps to see where students spend the most time and then make changes accordingly;
- Example 3: A company’s website uses heatmaps to see where visitors spend their time on the website, allowing them to make changes accordingly;
- Example 4: A hotel in Chicago uses heatmaps to see what rooms are occupied and identify ways to increase occupancy;
- Example 5: A hotel in Los Angeles uses heat maps to see where people are coming from and identify ways to improve the overall customer experience.
How to use heat maps: 5 Ways You Can Analyze Your Customers’ Behavior Using Heat Maps
Heat maps are helpful for website users to analyze their website browsing behavior.
This is because they can capture the user’s eye movement and mouse clicks on a webpage and use this information to determine what parts of the page are most interesting to them.
This article provides five ways to analyze your customers’ behavior using heat maps.
The following five methods will help you determine how your customers interact with your website https://creabl.com/service/session-recording:
- Heat map analysis is one of the most common ways to analyze customer behavior using heat maps. It tracks where visitors click on a webpage and then uses this information to determine which piece of content is most exciting or engaging for visitors.
- Mouse movement analysis: With this method, you track where visitors move their mouse on a webpage and then use this information to determine which piece of content is most exciting or engaging for visitors.
- Scroll analysis: This method tracks how often users scroll down a page and then uses this information to determine which piece of content is most exciting or engaging for visitors
- Click Analysis: With this method, you track where customers click on a webpage and then use this information to determine which piece of content is most exciting or engaging for visitors.
- Content analysis: This method analyzes the content of a page and then uses this information to determine which piece of content is most exciting or engaging for visitors.
Why are Heat Maps Important in your Marketing Strategy?